

Neuroscientists study functional connectivity between regions in a human brain to obtain a deeper understanding of how the brain functions. Since the data processed from f-MRI scans are of high complexity and dimensionality and a vast number of factors could affect brain activities, visualization becomes an indispensible tool for supporting detailed and flexible analyses of the data at multiple levels. Through collaborating with the UC Davis Center for Neuroscience, researchers at the VIDI Labs are developing new visual analytic solutions for neuroscientists to conveniently make sense of large datasets to accelerate the scientific discovery process.
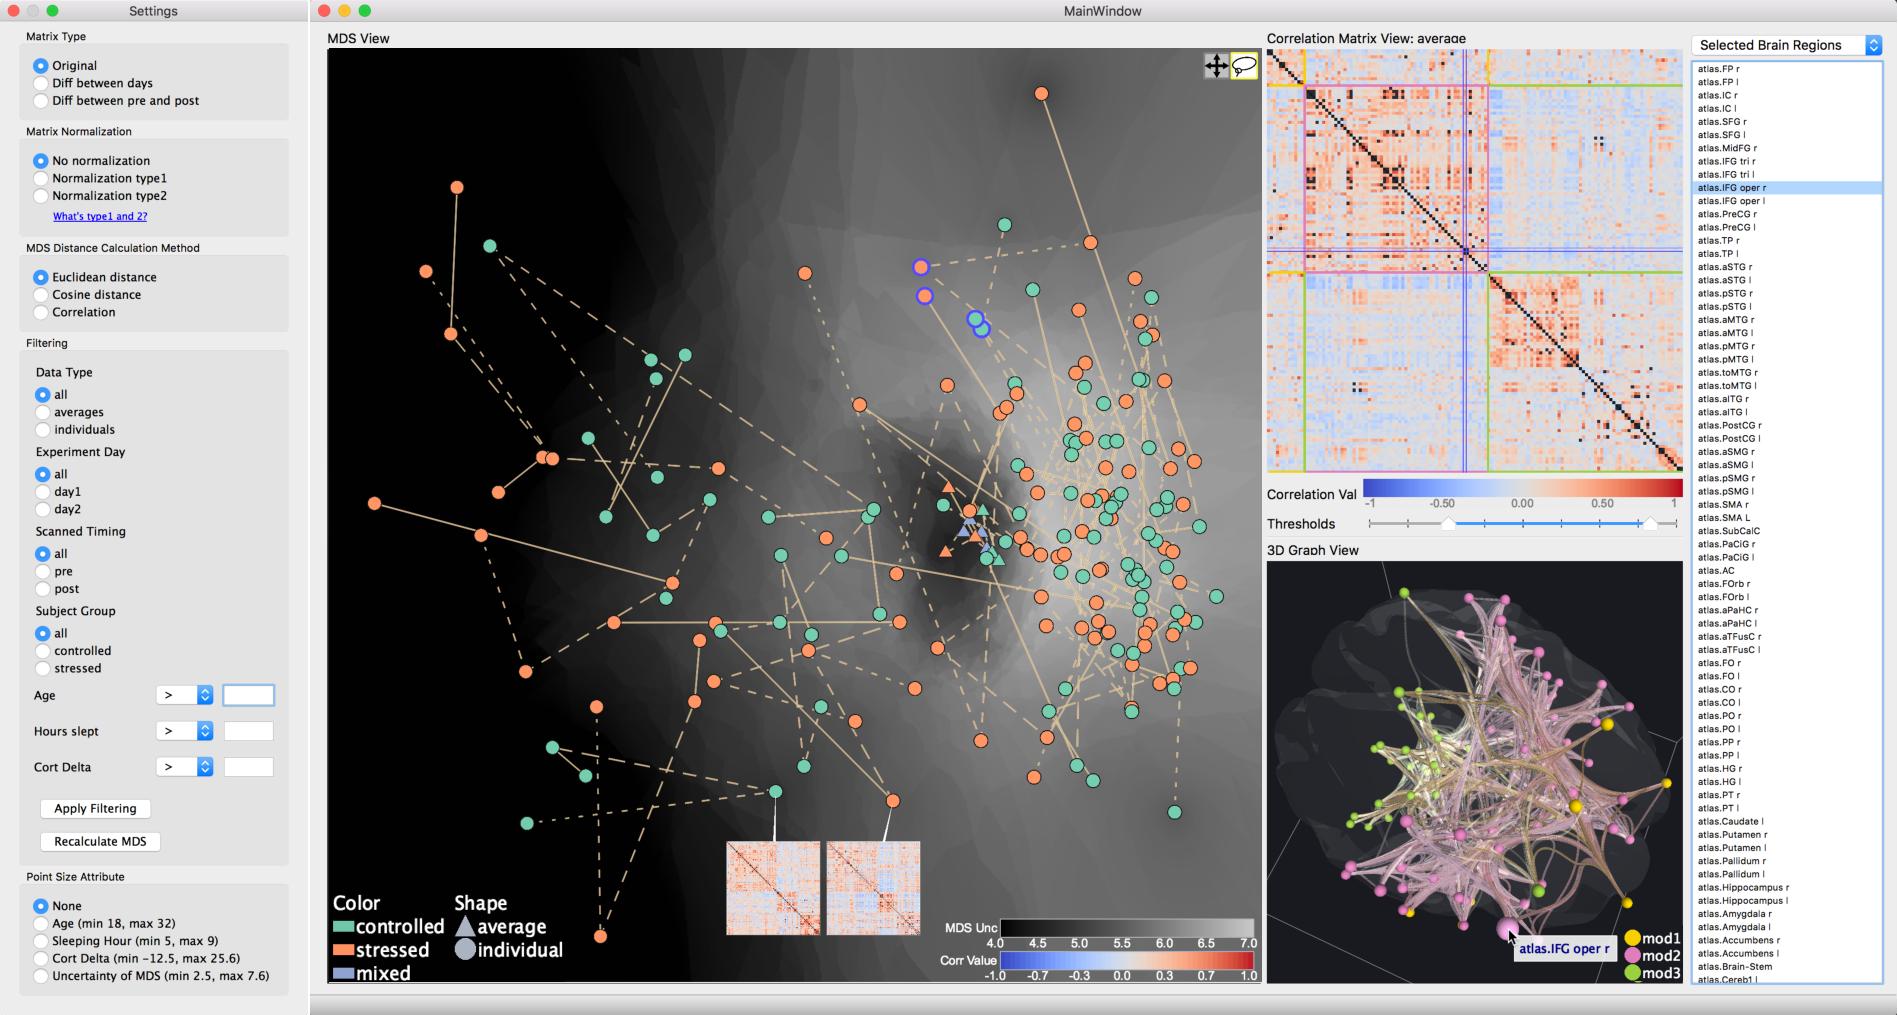
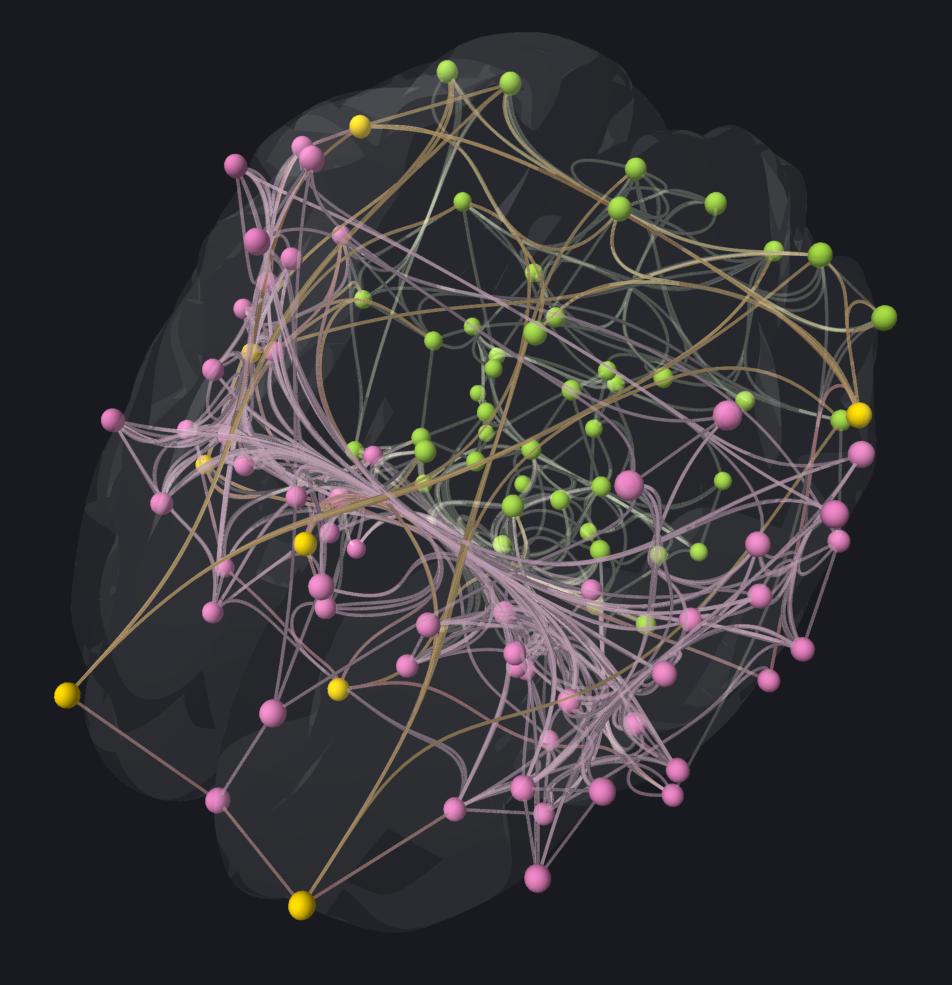
Here we introduce a visual analytics system for visually comparing the differences of brain networks between multiple individual subjects as well as group averages, and to manipulate the data and views to fit their analytical needs with easy interactions. The system allows the user to view the network and correlation data in different projection spaces and with different visual representations for gaining new insights in the data.
Paper:
Takanori Fujiwara, Jia-Kai Chou, Andrew M. McCullough, Charan Ranganath, and Kwan-Liu Ma, “A Visual Analytics System for Brain Functional Connectivity Comparison across Individuals, Groups, and Time Points”, In Proceedings of IEEE Pacific Visualization Symposium (PacificVis), 2017 pdf | bibTex
Video:
Introduction
Personnel:

Computer Science, UC Davis

Computer Science, UC Davis

Psychology, UC Davis

Computer Science, UC Davis

Neuroscience, UC Davis